Contact Us: contact@tolaga.com

There is a seemingly endless range of thought leadership for technology and service innovation. For example, a simple search for books on "technology innovation" at Amazon.com returns over 40 thousand search results, including seminal texts such as The Innovator's Dilemma by Clay Christensen and Crossing the Chasm by Gordon Moore, which investigate the dynamics, key markers, and successful strategies for developing innovations. In addition, Gartner's hype cycles aim to describe the maturity of technology and service innovations using hypothetical maturity profiles.
Tolaga's Online Activity Index (OAI) complements available thought leadership by measuring market momentum and maturity using online content.

The OAI allows you to:
The OAI uses proprietary web crawlers, Google and Duck-Duck-Go web indexes, and natural language processing (NLP) to quantify online activity and estimate the maturity of an innovative service or technology.

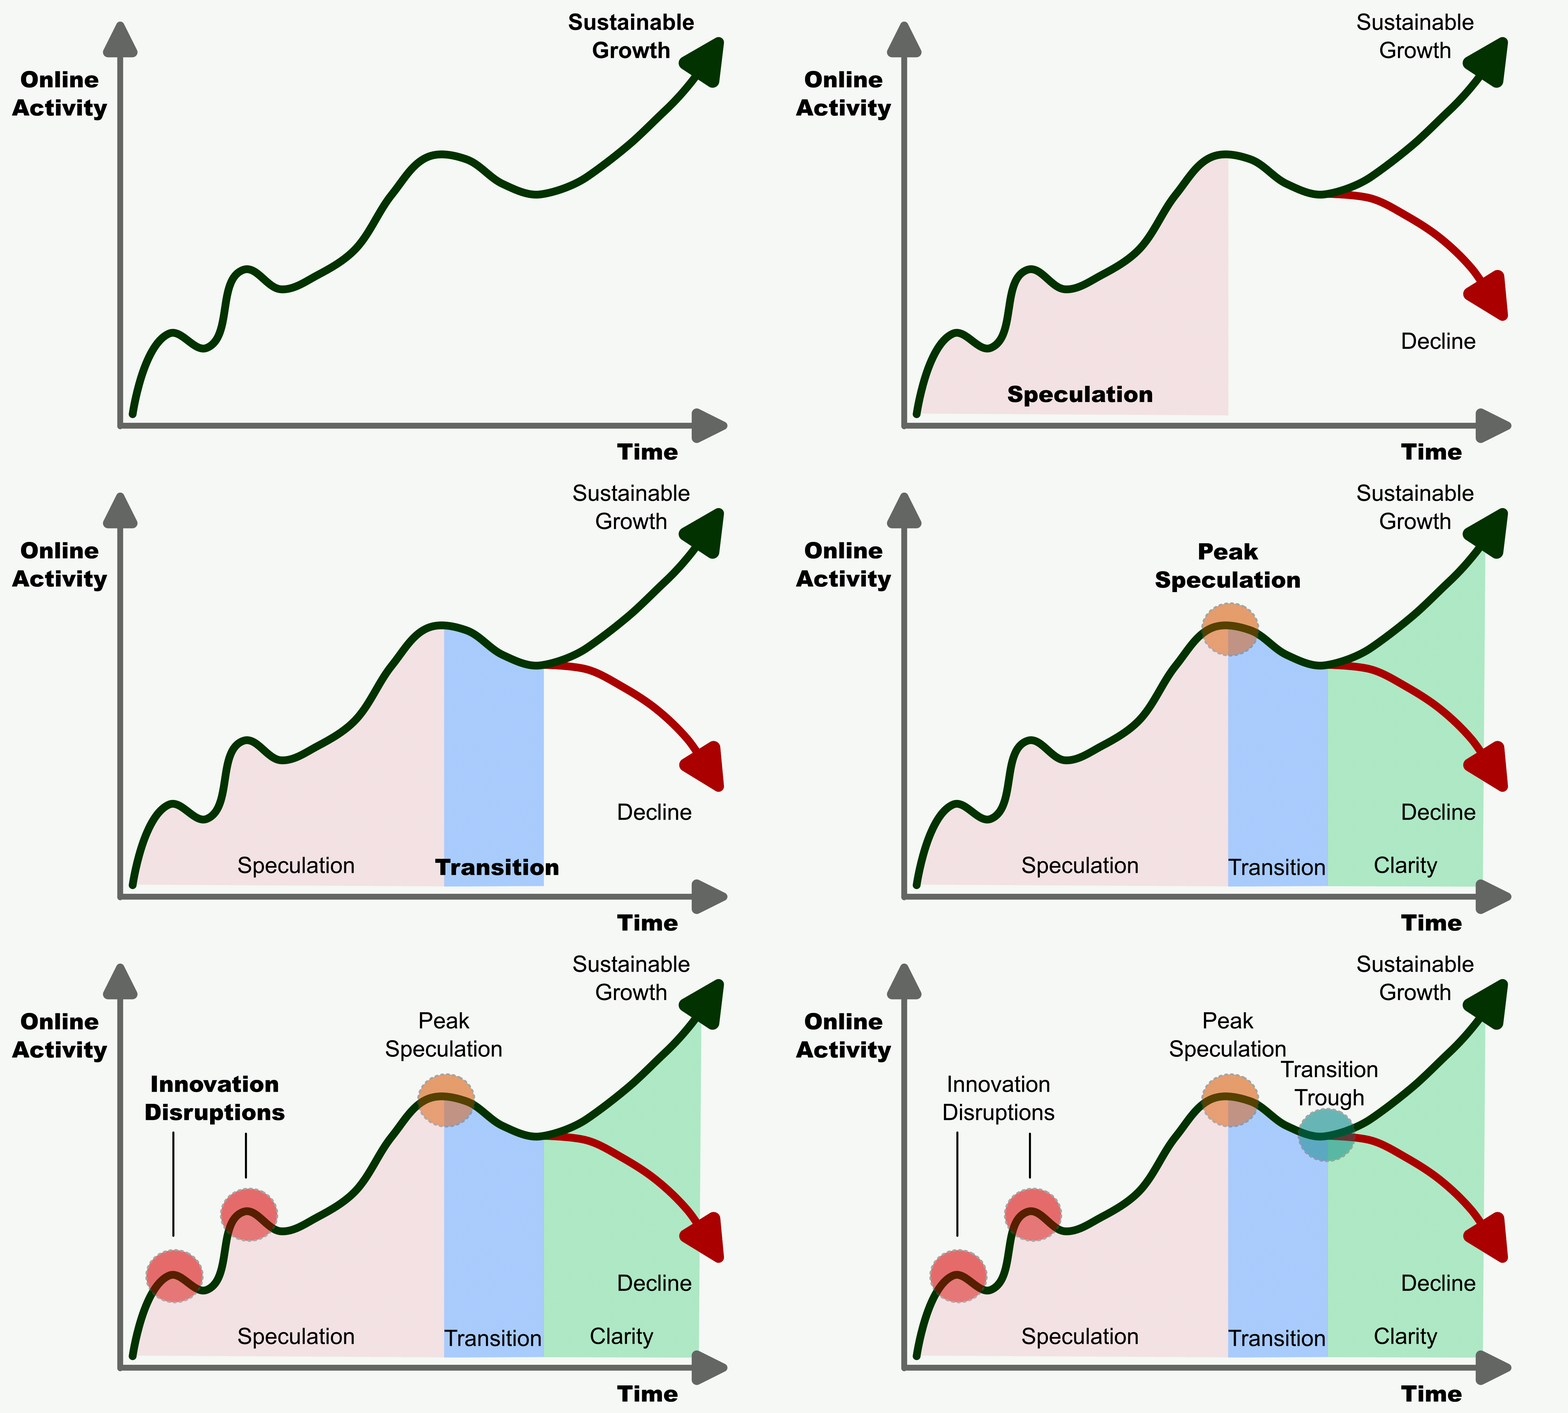
The OAI identifies three phases of maturity for a service or technology innovation, including speculation, transition, and clarity.
When first introduced, the success of a new technology or service innovation is not a foregone conclusion, and speculation fuels its potential prospects. Speculation increases with stakeholder promotions, proofs-of-concept deployments that evolve to become early market solutions, and other efforts to illustrate the innovation's salient characteristics. This growing speculation drives increased online activity that the OAI measures.
Trial-and-error experimentation is a typical hallmark of the speculation period, which often results in innovation missteps that diminish online activity for short periods or permanently for failed innovations. The linearity of online growth during the speculative period measures its volatility and indicates the extent of trial-and-error experimentation, innovation missteps, and the misalignment between perception and reality.
Ultimately peak speculation occurs when the technology or service innovation has matured to the point where the market opportunities are well understood. Still, exuberant online activity (potentially promoting unsustainable use cases) remains. This activity typically declines during the transition period to bring perception and reality into alignment. The transition can be confused with earlier innovation missteps and depends on qualitative root-cause assessments.
Once the OAI transitions to the clarity phase, online activity either increases with sustainable market growth or declines when the technology or service innovation is unviable.
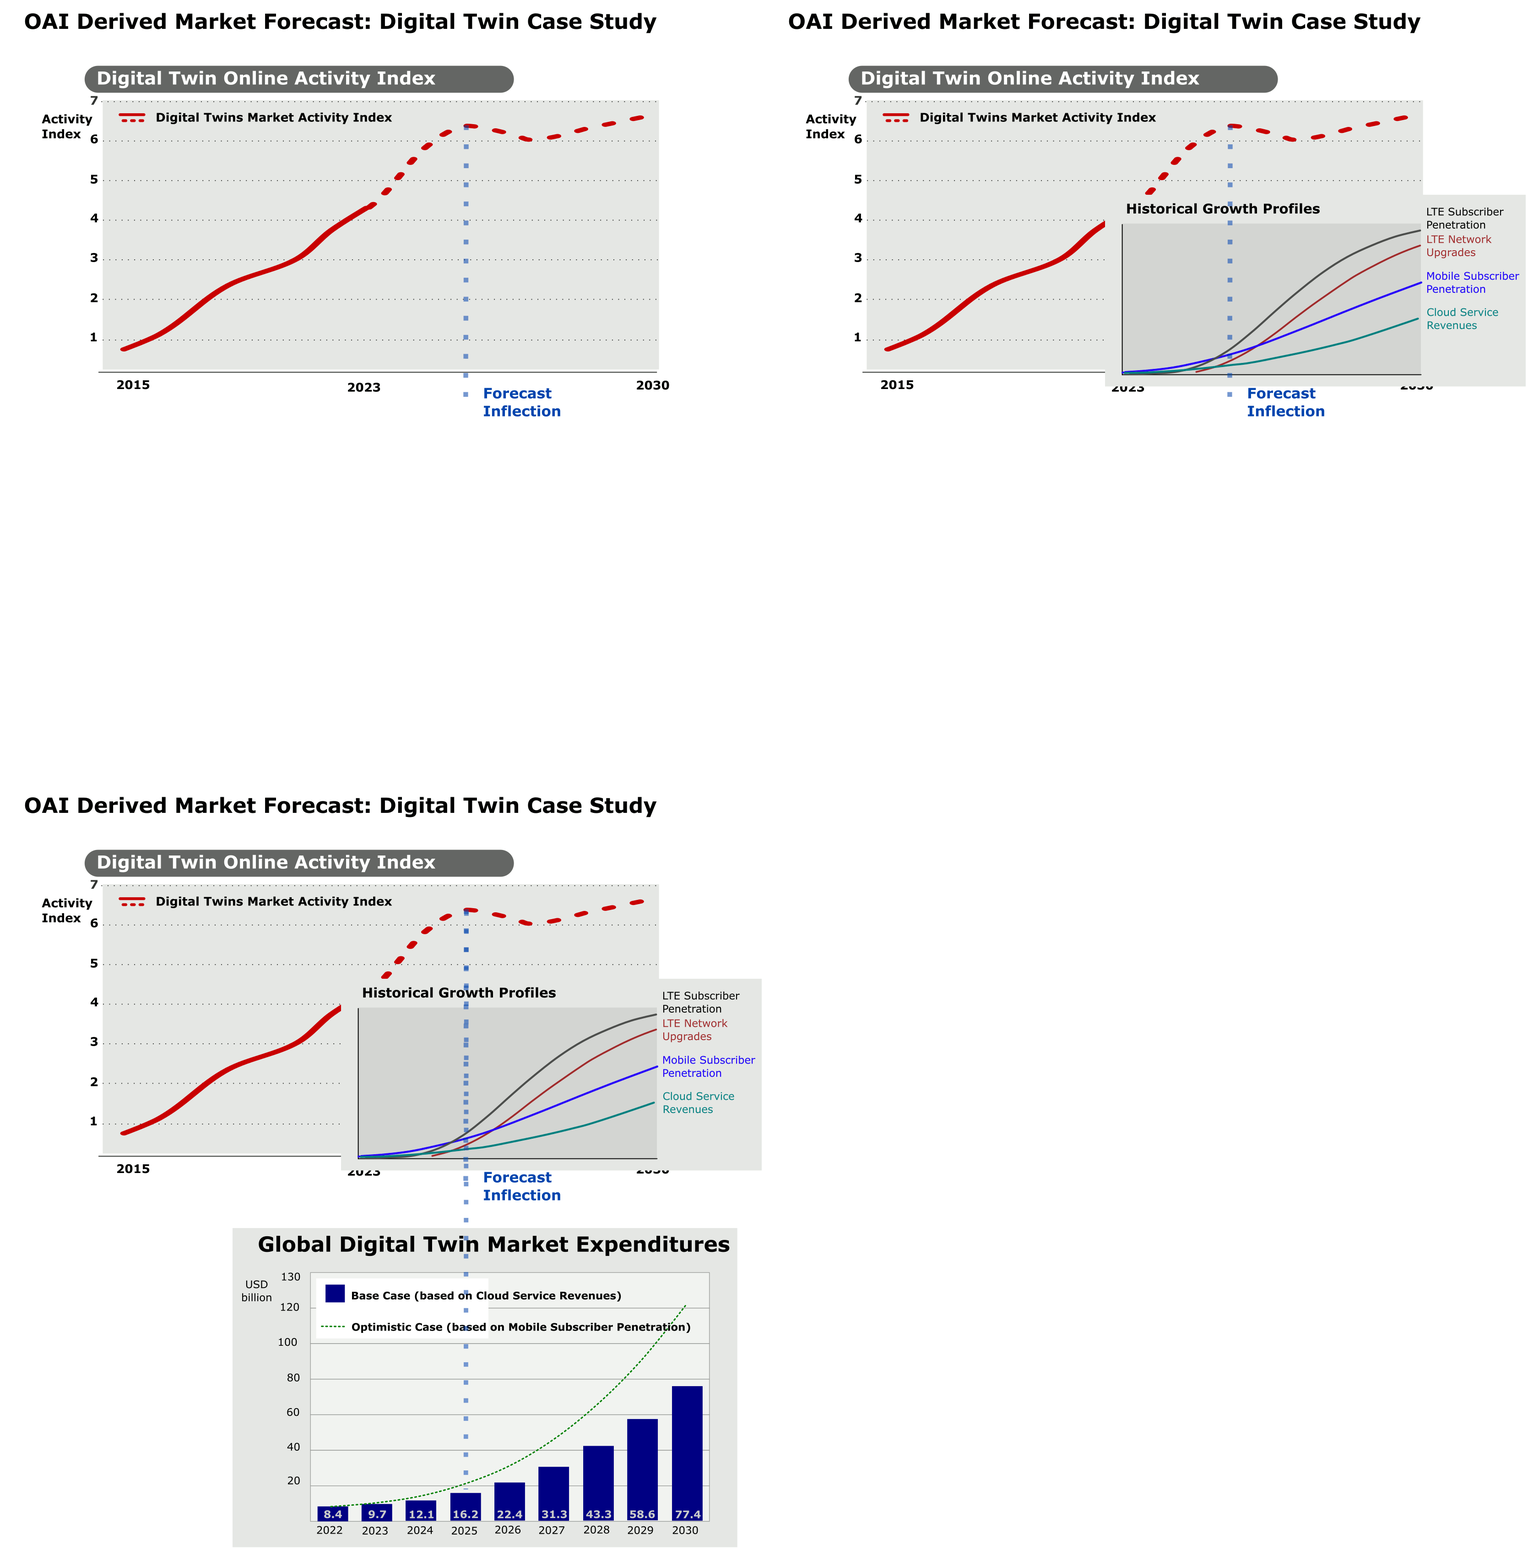
Online activity tracking provides a historical perspective for the OAI, and the profiles for other comparable legacy innovations can provide a precedent for forecasting. For example, digital twins are emerging innovations that have witnessed increased online activity in a speculative phase since 2015. Based on the historical innovation activity index for augmented reality, it is reasonable to assume that speculation for digital twins will peak in 2025 and reach clarity by 2027. Other OAI profiles can be used to investigate alternative scenarios.

Profile comparisons provide valuable insights into the relative state of different innovations and indicators of future outcomes. For example, the gradient and linearity of the index during the speculative phase illustrate the relative volume and volatility of online activity relating to different technology and service innovations by comparing innovations currently in their speculative phase and those already matured to provide additional context for the OAI.
For example, the activity index gradients for 5G and Digital Twins between 2015 and 2022 were 0.79 and 0.51, respectively. Over this period, 5G has captured more significant online momentum than digital twins. Both 5G and digital twins have relatively linear gradients over this period, with linear coefficients of R2 of 0.97 and 0.99, respectively.
By contrast, the activity index gradient for augmented reality between 2009 and 2015 was 0.39, with an R2 of 0.91. The steeper gradients for 5G and Digital Twins indicate greater exuberance than that for Augmented Reality between 2009 and 2015. Both 5G and digital twins have experienced some innovation missteps between 2015 and 2022, however they have not had a dramatic impact on the activity indices because both technology innovations are diversified and are underpinned by the sustaining innovations to 4G in the case of 5G and simulation and modeling in the case of digital twins.

A market forecast is driven by a variety of factors, most notably the initial market state, addressable market limitations, the conditions that drive organic and self-reinforcing (viral) growth and the inflection points for viral adoption. Tolaga has two general forecasting methods, including System Dynamics based market simulation and forecast models, and forecast models that are derived from OAIs. In particular, these forecast models:
