Contact Us: contact@tolaga.com

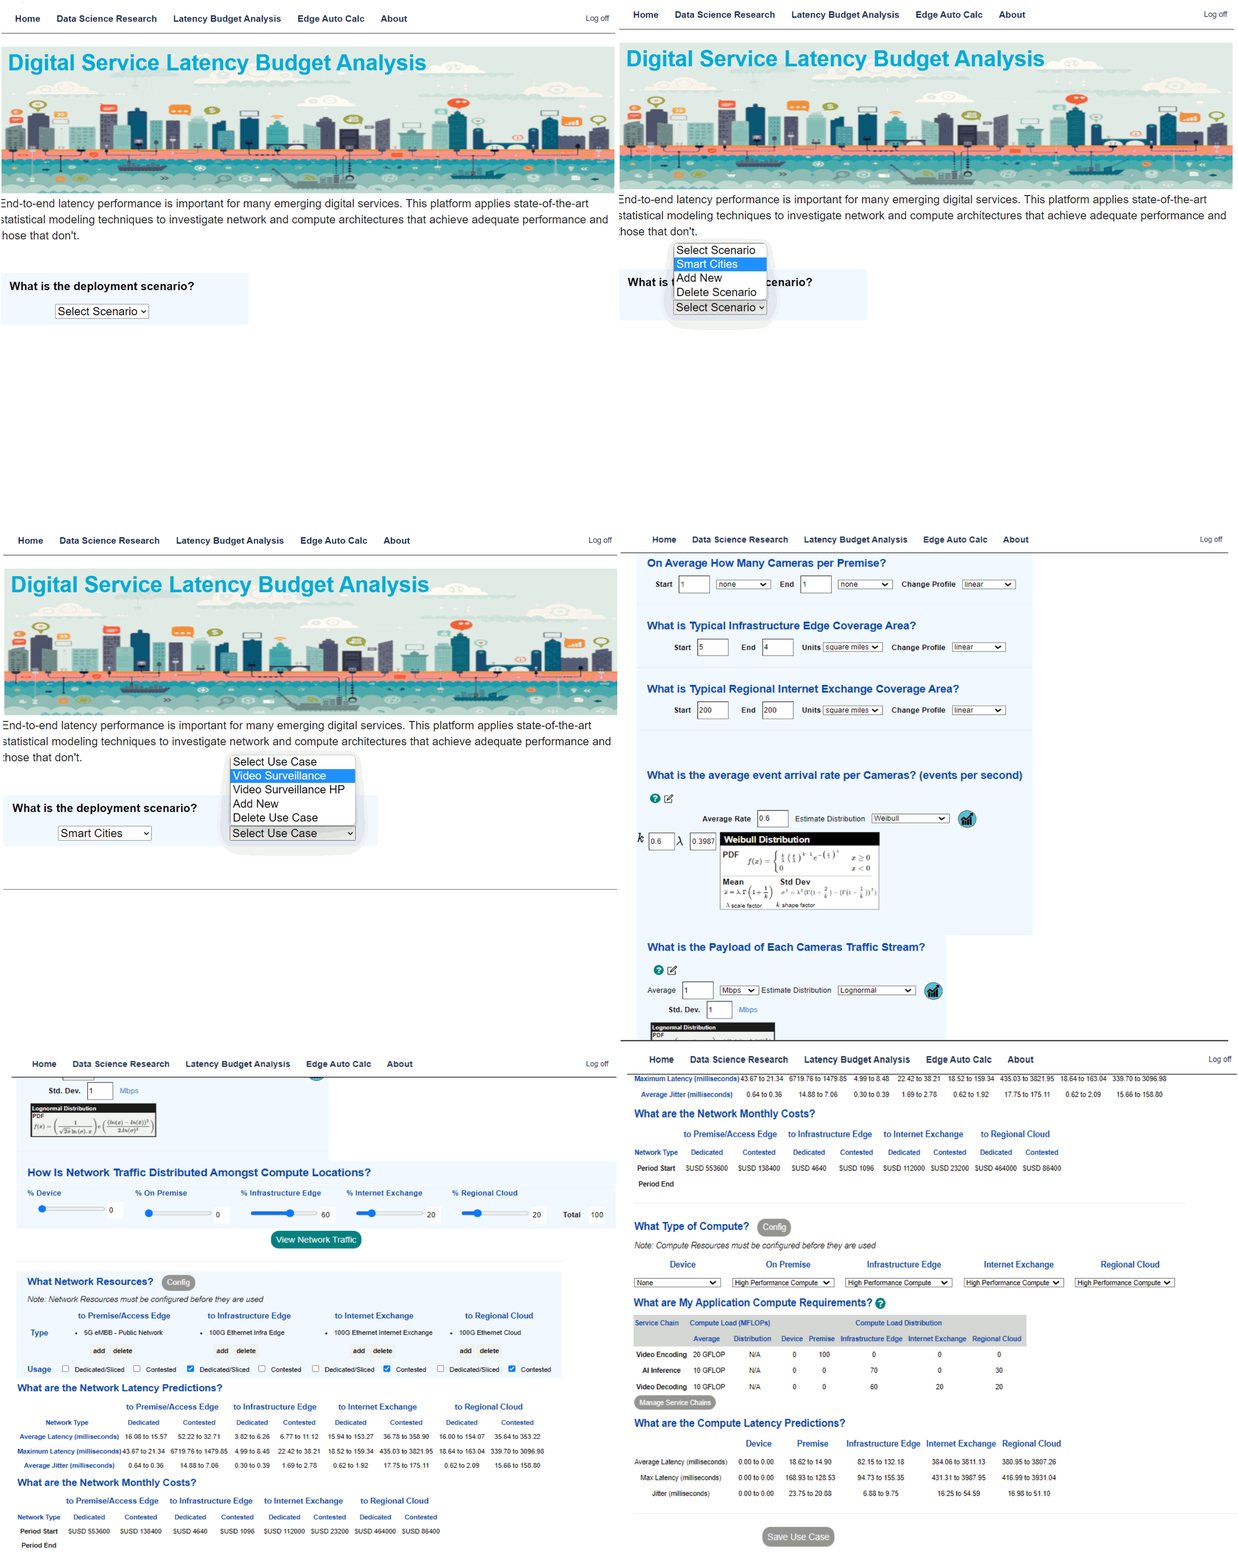
Digital service latency performance is important for reliability and user experience but poorly characterized because of its many contributing factors, including network congestion, buffering, compression techniques, and traffic payload. A web based simulation platform was developed to model end-to-end latency for user defined services and service chains.
Video surveillance is a core feature of smart cities for public safety and city efficiency. There are ninety fixed cameras per square mile in city centers on average. However, cities like Delhi, London, Chennai, and Shenzhen have much higher camera densities ranging between five and eighteen hundred per square mile.
Smart city video surveillance is rapidly advancing to support increasing public safety and city operational demands. Legacy closed circuit television (CCTV) cameras are being upgraded with AI computer vision technologies and real-time connectivity. As these solutions expand, they are complemented with advanced sensor technologies and alternative video solutions from drones, vehicles and on-body cameras worn by police officers, security guards, and paramedics.

The optimal design of video surveillance systems is complicated, with different performance requirements depending on the service. For example, number plate recognition solutions have low video resolution and latency performance demands. By contrast, real-time facial recognition has high resolution and latency performance demands. In addition, on-body and drone cameras require small form factors and power footprints compared to typical fixed camera installations. In the Latency Budget Analysis simulation platform, models for each unique scenario can be analyzed to predict the latency performance and cost of different deployment scenarios.
In contrast to traditional queuing models that erroneously use Poisson arrivals, the simulation tool provides options for Weibull, Gamma, Power, and Lognormally distributed arrival profiles, which are more accurate. Weibull, Gamma, Power, Gaussian, and Lognormal distributions are also used to account for payload variations attributable to image compression. The performance of computing resources for each service chain and the placement of computing workloads enable latency and cost calculations for different placement scenarios. Networking and connectivity resources can be shared or dedicated and provisioned with different bandwidths and resilience. Therefore, statistical latency calculations incorporate the impact of transmission distance, congestion, bandwidth, and buffering for evaluating performance and cost tradeoffs.